Getting Started with GTmetrix
The need for fast-loading websites becomes increasingly critical as the internet continues to evolve. Not only does site speed affect user experience, but it also has a significant impact on search engine rankings. That’s why GTmetrix, a free page speed and performance analysis tool, has become essential for web developers and site owners.
Developed by the folks at GT.net, a web hosting company based in Vancouver, GTmetrix is the ultimate solution for monitoring and analyzing your website's performance. What differentiates GTmetrix from other analysis tools is combining the best of Google's PageSpeed tests with Yahoo's YSlow scoring matrix.
The result is a powerful tool that provides you with a wealth of graded data on exactly what's causing your site speed issues. Unlike Google PageSpeed Insights, GTmetrix offers a more practical and visual representation of the data, making it easier to identify areas of improvement.
One of the most impressive aspects of GTmetrix is that it fully integrates with WordPress via their plugin, available from the WP repository. This plugin allows you to conduct speed tests without ever having to leave your WordPress dashboard, saving you time and effort.
However, the results generated by speed analysis tools like GTmetrix can be cryptic and unclear, leaving non-tech-savvy site owners at a loss. That's where this post comes in. Our goal is to identify the most common issues that could appear when you use GTmetrix and provide you with actionable tips on how to fix them.
By following our guide, you can DIY speed up your site and improve your search engine rankings even if you're not a nerdy tech person. To generate the API key required to run this plugin, you'll need to register for a free GTmetrix account.
Setting Up the Ideal Test on GTmetrix
If you're serious about optimizing your website's performance, then GTmetrix is the tool for you. But to get the most out of this powerful tool, you need to set up the perfect test parameters.
Setting Up an Account
First and foremost, we strongly recommend creating a free account on GTmetrix. Not only is it free, but you don't even need to provide payment information. So, there's no excuse not to register.
But, registering isn't just about convenience; it's also crucial for correctly setting the parameters for your test. Without an account, you won't be able to choose the test server location, which is critical for getting accurate localized page speed scores.
Server
So, once you've registered, you first need to choose the server that is the closest geographical match to your own. This will provide you with an accurate representation of real user experience based on localized page speed scores.
Browser
Next, you can choose which desktop or mobile browser is used to test the rendering of your URL. This step is important since different browsers can display the same website in different ways.
Connection Speed
But that's not all; you also need to choose the connection speed the test should be conducted against. For example, if you're testing how pages load and display on mobile devices, you'll want to select a slower connection speed like 3G to get an accurate representation of how your site performs on mobile devices.
Other Options
Additionally, you can toggle some additional test options on or off, depending on your needs. For example, creating a video generates a short video that shows exactly how your page loads, allowing you to identify components that might block or slow rendering.
You can also use the Adblock Plus setting to disable ads to assess how they impact your overall site speed. And, if you want to get even more accurate results, you can disable the "Stop test Onload" setting. By default, GTmetrix tests wait for 2 seconds of network inactivity before grading your site, which can sometimes skew result data. But in most circumstances, you can leave this setting disabled.
Reading a GTmetrix Report
If you've run a performance report on GTmetrix, you might be overwhelmed by the sheer amount of data presented to you. But fear not, we're here to help you decode your report and understand what it all means.
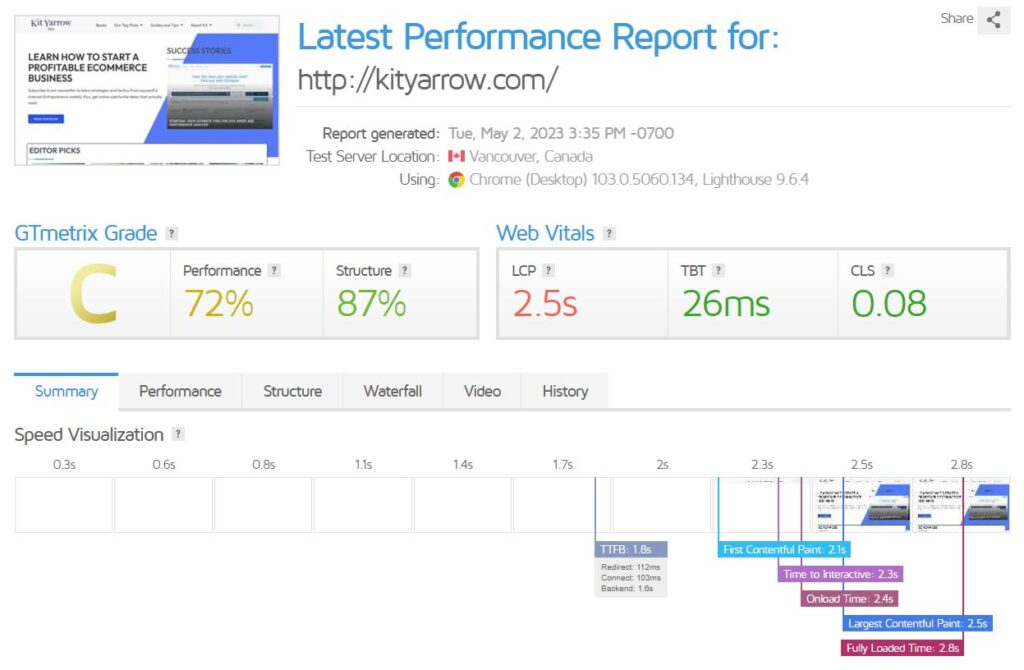
Firstly, let's start with the report dashboard. This section gives you an "at a glance" overview of how your URL performed. Here are the two most critical scores to consider:
- PageSpeed - This is the grade your page receives based on Google's metrics.
- YSlow - This is the grade your page receives based on how Yahoo would score it.
In general, a PageSpeed score of 90% or higher and a YSlow score of 80% or higher is considered good. In the example above, our PageSpeed score is 72% (C grade), indicating we have some work to do. Our YSlow score is 81% (B grade), which isn't perfect but suggests we only need to tweak a few things to get closer to an A grade rating of 90%.
Next, let's move onto the 'Page Details' section, where you'll find a wealth of information to help you optimize your site. Here are some of the key metrics to pay attention to:
- Fully Loaded Time - This metric measures the length of time required for your page to become interactive in the test browser. This includes all assets such as images, scripts, and other elements. A faster fully loaded time leads to better user experience and improved search engine rankings.
- Total Page Size - This metric measures the total amount of data downloaded to the test server, including all media assets such as images. A smaller page size can lead to faster loading times and improved user experience.
- Requests - This metric measures the number of individual HTTP requests generated by your site via scripts, CSS, and other elements. Fewer requests can lead to faster loading times and improved site performance.
By focusing on these three metrics, you can quickly identify areas for improvement and optimize your site for faster loading times and improved user experience. GTmetrix provides additional data and insights that can help you dive deeper into your site's performance, but these three metrics should be your starting point.
Optimizing Your Website with GTmetrix Performance Recommendations
Once you have run a performance report, you can use the tool's recommendations to identify areas for improvement and optimize your site for faster loading times and improved user experience.
Here are some of the key recommendations provided by GTmetrix:
PageSpeed Recommendations:
- Optimize Images - Images account for at least 60% of a page's total weight, so unoptimized images can significantly slow down your site. To fix this, use a plugin like Smush or ShortPixel to optimize your images.
- Serve Scaled Images - Uploading images that are too big or too small can cause your page to load more slowly. Serve scaled images that are "just right" to avoid this issue.
- Minimize Redirects - Redirects can slow down your site, so avoid using them whenever possible. If you already have a lot of redirects, use a plugin like Redirection to cut multiple redirects into a single one.
- Minify CSS and JS - Minifying CSS, JavaScript, and HTML files can reduce file size and boost page speed. Use a caching plugin like WP Rocket or Cloudflare to do this.
- Inline CSS and JS - Combining scripts from multiple pages into a single script that can load asynchronously can improve page speed. If scripts are made up of only a few lines of code, it may be better to place them inline on the page.
- Defer Parsing of JavaScript - JavaScript requests can cause slow page load times, so fix this issue by using the "Aggregate JS-files" feature in Autoptimize.
- Leverage Browser Caching - Implement browser caching with a free caching plugin like W3 Total Cache or check with your provider as their solutions are often custom tailored for their server setup.
- Enable Gzip Compression - Set up gzip compression to make files smaller on the fly and improve page load times.
YSlow Recommendations:
- Use a Content Delivery Network (CDN) - A CDN stores a copy of your site on servers in different locations around the world, ensuring a faster viewing experience for visitors worldwide. Cloudflare is a popular CDN.
- Add Expires Headers - Use "Expires Headers" to tell a server when to no longer use a cached version of the page and to load a new one instead.
- Use Cookie-Free Domains - Using cookie-free domains can optimize your site speed. Avoid overusing cookies if you don't use the associated services.
- Avoid HTTP 404 (Not Found) Error - Use a broken link checker plugin or the free version of Screaming Frog crawler to track down 404s on your site.
- Reduce DNS Lookups - Too many DNS lookups can cause problems with page speed, so trim the number of DNS lookups your site generates.
Reading the Waterfall
The 'Waterfall' chart is a powerful tool that provides a visual representation of every request made by your website, including media files, CSS, JavaScript, and more. This chart takes the guesswork out of identifying what's slowing down your site and shows you in what order each request was executed.
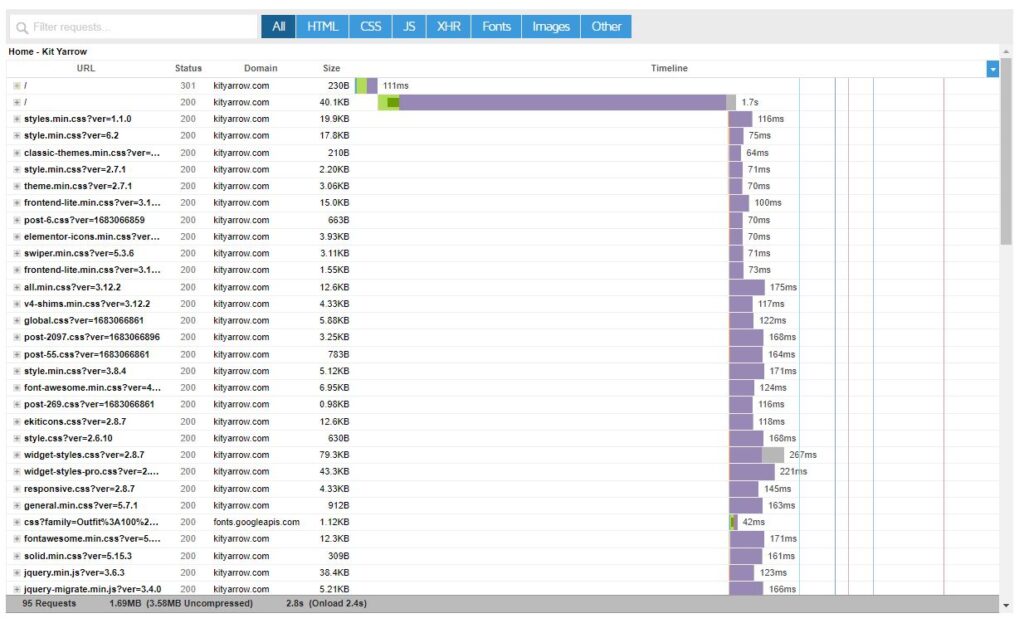
The color bands on the chart indicate different stages of the loading process, such as teal for DNS lookup, brown for blocking, green for connecting, red for sending, purple for waiting, and gray for receiving. This makes it easy to pinpoint where delays are occurring and what might be causing them.
For example, if you see long delays after the SSL certificate has loaded, it could be an indication of a slow or shared server. If there are large sections of brown, it means that other page elements are unable to load until these JS and CSS elements have loaded.
One solution to this problem is to defer parsing of both file types using the Autoptimize plugin and minify them with a caching plugin like WP Rocket. This way, these elements will load after the main content, reducing the blocking time and improving your site speed.
Timings Section
The "Timings" section of GTmetrix Performance Report provides you with a breakdown of the loading times of various elements on your webpage. These loading times can have a significant impact on your site's speed, which can, in turn, affect user experience.
The "Time To First Byte" indicates the time taken by the server to deliver the first byte of data to the browser. The "First Paint" time refers to the time taken to render the initial layout of the page in the browser, while the "First Contentful Paint" is the time taken to render the first piece of content on the page.
The "DOM Loaded" time is when the browser has finished loading the HTML content and the JavaScript code starts executing. The site should be fully loaded by the "Onload" time, which is an indication of how complex the design of your site is or how many HTTP requests your site is generating through multiple JavaScript files.
It is crucial to pay attention to the "Onload" time because if it takes too long, users may get impatient and leave your site. The "Fully Loaded Time" indicates the time taken for the page to become fully interactive, and there may be a delay between "Onload" time and "Fully Loaded Time" due to network inactivity or missed events.
Alternatives to GTmetrix
If you're looking for alternatives to GTmetrix, there are several options available. One popular choice is Pingdom, which not only provides in-depth speed tests but also offers active monitoring of your website(s). Although it's a paid service, you can try it out for free without having to enter any credit card information. Another tool worth checking out is Google PageSpeed Insights, which is a free tool from Google that provides site speed tests for mobile devices and has improved its visual display over the last year.
For those who prefer an old but reliable option, Web Page Test is a popular choice for SEOs and website designers. It has a waterfall feature similar to GTmetrix and a TraceRT function that's also useful. Lastly, you can also use the basic speed testing functions available in Google Analytics, which provide data on page speed across multiple devices and locations worldwide.
Final Thoughts
GTmetrix is an invaluable tool for anyone looking to optimize the speed and performance of their website. With its detailed performance reports, recommendations, and visual aids such as the waterfall chart and timings, GTmetrix makes it easy to identify areas for improvement and take the necessary steps to enhance the user experience.
By optimizing images, serving scaled images, minimizing redirects, minifying CSS and JS, deferring parsing of JavaScript, leveraging browser caching, and enabling Gzip compression, you can significantly improve your site's speed and performance.
And if GTmetrix isn't quite what you're looking for, there are plenty of other great speed testing tools out there to choose from. Whether you use Pingdom, Google PageSpeed Insights, Web Page Test, or the speed testing functions in Google Analytics, the key is to test regularly and optimize continually.
With the help of these tools and a commitment to ongoing improvement, you can ensure that your website loads quickly, delivers a smooth user experience, and ultimately achieves your goals.